HXM360
HXM is the next evolution of Human Capital Management (HCM), providing organizations with the tools and technology to enable meaningful, productive, and personal employee experiences that drive business results.
What is HXM 360?
HXM stands for Human Experience Management and focuses on putting people at the center of business to drive transformative results. Like HCM, HXM connects core HR and payroll, talent management, and people analytics, but with a unique focus on the employee experience. By understanding, anticipating, and listening to the needs and expectations of everyone, HXM enables organizations to deliver relevant experiences for employees, managers, candidates, new hires, HR leaders, administrators, and more.
Product Summary
Human Experience Management (HXM) 360° is the solution that encompasses various key HR modules, including,
Recruitment and Staffing focusing on efficient talent acquisition.
Workforce Engagement aimed at boosting satisfaction and involvement.
Training and Development emphasizes upskilling and continuous learning.
Compensation and Benefits ensures streamlined management of employee rewards.
Productivity and Performance management tracks workforce effectiveness
Employee Retention designed to reduce turnover and maintain employee satisfaction.
To enhance the user experience, SAP Analytics Cloud (SAC), “planning feature” is being utilized. This allows for advanced data-driven insights, predictive analytics, and real-time decision-making, improving the overall effectiveness of the HXM 360° solution.
BTP Services
SAP Analytics Cloud
SAP Analytics Cloud helps to build complete solutions for HXM analytics and planning that enables users to make business-critical decisions with the help of interactive dashboards built on top of multiple data sources.
SAP Datasphere
Data from SAP SuccessFactors is brought into SAP Datasphere for enabling Planning in various modules –
- Benefits Planning
- Salary Planning
End State Solution
Pre-built templates which map to the HXM modules in the SAP SuccessFactors. The below HXM modules are present in our HXM 360° solution –
Recruitment and Staffing focusing on efficient talent acquisition.
There are two SAC dashboards under recruitment and staffing,
Headcount and Vacancy Analytics
Optimize workforce planning with real-time headcount and vacancy insights. Visualize gaps, track hires and exits, and align talent needs with business goals. This dashboard offers a comprehensive view of workforce metrics, including department-wise headcount, demographics, and exit reasons.
Recruitment Strategy Analytics
Get real-time insights into recruitment with a streamlined dashboard. Track key hiring metrics, monitor internal and external hires, manage requisitions, and enhance decision-making with data-driven strategies.
Workforce Engagement aimed at boosting satisfaction and involvement.
There are three dashboards under workforce engagement,
Workforce Performance Report
Gain real-time insights into performance metrics to boost productivity and align with business goals. This dashboard highlights absenteeism trends, training costs, labor effectiveness, and employee data for informed decision-making.
Employee Survey Report
Get real-time insights into employee sentiment with our survey dashboard. Track key satisfaction metrics, review survey reports, and boost engagement with recommended questions.
Employee Exit Interview Report
Analyze exit interview data to uncover key reasons for turnover and improve retention. This dashboard highlights main departure reasons, new role motivators, exit survey insights, company culture ratings, and the most valued workplace aspects..
Training and Development emphasizes upskilling and continuous learning.
Empower your workforce with real-time insights into training progress, skill development, and learning outcomes. Drive continuous improvement with data-driven decisions for personalized employee growth.
This dashboard gives an overview of the number of training courses, training budget, actual spent, training completed, training pending, employee proficiency level, improved skill ratio and budget vs spent department wise.
Compensation and Benefits ensures streamlined management of employee rewards.

Gain real-time insights into employee compensation and benefits to ensure competitive packages and drive workforce satisfaction. Track, analyze, and optimize your compensation strategy with ease.
This dashboard breaks down total salary into base salary, benefits amount, overtime cost and deduction amount department wise. It also shows the claimed and allocated benefit amount and helps the end user to do benefit amount planning.
Productivity and Performance management tracks workforce effectiveness.
Empower your workforce with real-time insights on performance metrics, enabling data-driven decisions to boost productivity. Track individual and team achievements, ensuring alignment with organizational goals.
This dashboard helps the end user to track the top 5 performers, overall employee score, overall score based on age group and gender help contributing in finding the performance of every employee.
Employee Retention designed to reduce turnover and maintain employee satisfaction.
Track and analyze key retention metrics to reduce turnover and improve employee satisfaction across your organization. Gain insights into attrition risks, engagement levels, and retention strategies to foster a loyal and motivated workforce.
This dashboard gives an overview of exit count, hire count, hire per month, exit per month, resignation count, resignation count with reason, retainment count and actual exit.
Recruitment and Staffing focusing on efficient talent acquisition.
There are two SAC dashboards under recruitment and staffing,
Headcount and Vacancy Analytics
Optimize workforce planning with real-time headcount and vacancy insights. Visualize gaps, track hires and exits, and align talent needs with business goals. This dashboard offers a comprehensive view of workforce metrics, including department-wise headcount, demographics, and exit reasons.
Recruitment Strategy Analytics
Get real-time insights into recruitment with a streamlined dashboard. Track key hiring metrics, monitor internal and external hires, manage requisitions, and enhance decision-making with data-driven strategies.
Workforce Engagement aimed at boosting satisfaction and involvement.
There are three dashboards under workforce engagement,
Workforce Performance Report
Gain real-time insights into performance metrics to boost productivity and align with business goals. This dashboard highlights absenteeism trends, training costs, labor effectiveness, and employee data for informed decision-making.
Employee Survey Report
Get real-time insights into employee sentiment with our survey dashboard. Track key satisfaction metrics, review survey reports, and boost engagement with recommended questions.
Employee Exit Interview Report
Analyze exit interview data to uncover key reasons for turnover and improve retention. This dashboard highlights main departure reasons, new role motivators, exit survey insights, company culture ratings, and the most valued workplace aspects..
Training and Development emphasizes upskilling and continuous learning.
Empower your workforce with real-time insights into training progress, skill development, and learning outcomes. Drive continuous improvement with data-driven decisions for personalized employee growth.
This dashboard gives an overview of the number of training courses, training budget, actual spent, training completed, training pending, employee proficiency level, improved skill ratio and budget vs spent department wise.
Compensation and Benefits ensures streamlined management of employee rewards.
Gain real-time insights into employee compensation and benefits to ensure competitive packages and drive workforce satisfaction. Track, analyze, and optimize your compensation strategy with ease.
This dashboard breaks down total salary into base salary, benefits amount, overtime cost and deduction amount department wise. It also shows the claimed and allocated benefit amount and helps the end user to do benefit amount planning.
Productivity and Performance management tracks workforce effectiveness.
Empower your workforce with real-time insights on performance metrics, enabling data-driven decisions to boost productivity. Track individual and team achievements, ensuring alignment with organizational goals.
This dashboard helps the end user to track the top 5 performers, overall employee score, overall score based on age group and gender help contributing in finding the performance of every employee.
Employee Retention designed to reduce turnover and maintain employee satisfaction.
Track and analyze key retention metrics to reduce turnover and improve employee satisfaction across your organization. Gain insights into attrition risks, engagement levels, and retention strategies to foster a loyal and motivated workforce.
This dashboard gives an overview of exit count, hire count, hire per month, exit per month, resignation count, resignation count with reason, retainment count and actual exit.
Planning features of SAP Analytics Cloud is utilized to enhance the experience for the solution users.
End State Solution
Pre-built templates which map to the HXM modules in the SAP SuccessFactors. The below HXM modules are present in our HXM 360° solution –
There are two SAC dashboards under recruitment and staffing,
- Headcount and Vacancy Analytics
Optimize workforce planning with real-time headcount insights and vacancy trends. Drive strategic hiring decisions by visualizing gaps and aligning talent needs with business goals.
This dashboard gives an overall analytical view of the total workforce, vacancies, active employees and many more. Department wise headcount, age diversity, demographics, employees joined, left and terminated and their exit reason.
- Recruitment Strategy Analytics
Gain real-time insights into recruitment performance and optimize your talent acquisition with data-driven strategies. Track key metrics, streamline hiring processes, and improve decision-making with an intuitive analytics dashboard.
This dashboard gives an overview of Internal cross hiring and external hiring, requisition open and close and requisition planning.
There are three dashboards under workforce engagement,
- Workforce Performance Report
Empower your team with real-time insights into performance metrics, driving productivity and alignment with business goals. Streamline decision-making with data-driven evaluations and actionable feedback.
This dashboard gives an overview of absenteeism of last few years, training cost , overall labour effectiveness, average absenteeism rate and employee details.
- Employee Survey Report
Gain real-time insights into employee sentiment with our intuitive survey dashboard, designed to enhance engagement and drive strategic improvements. Measure key satisfaction metrics to foster a productive, motivated workforce.
This dashboard gives a Survey report with recommended questions and it’s satisfaction metrics.
- Employee Exit Interview Report
Gain insights from exit interviews to identify key drivers of turnover and enhance retention strategies. Analyze trends and feedback to improve employee experience and reduce future attrition.
This dashboard gives an insight about the main reason to leave, reason to accept new positions, an exit survey, ratings of company culture and aspects that employees liked the most about the company.
Empower your workforce with real-time insights into training progress, skill development, and learning outcomes. Drive continuous improvement with data-driven decisions for personalized employee growth.
This dashboard gives an overview of the number of training courses, training budget, actual spent, training completed, training pending, employee proficiency level, improved skill ratio and budget vs spent department wise.
Gain real-time insights into employee compensation and benefits to ensure competitive packages and drive workforce satisfaction. Track, analyze, and optimize your compensation strategy with ease.
This dashboard breaks down total salary into base salary, benefits amount, overtime cost and deduction amount department wise. It also shows the claimed and allocated benefit amount and helps the end user to do benefit amount planning.
Empower your workforce with real-time insights on performance metrics, enabling data-driven decisions to boost productivity. Track individual and team achievements, ensuring alignment with organizational goals.
This dashboard helps the end user to track the top 5 performers, overall employee score, overall score based on age group and gender help contributing in finding the performance of every employee.
Track and analyze key retention metrics to reduce turnover and improve employee satisfaction across your organization. Gain insights into attrition risks, engagement levels, and retention strategies to foster a loyal and motivated workforce.
This dashboard gives an overview of exit count, hire count, hire per month, exit per month, resignation count, resignation count with reason, retainment count and actual exit.
- Planning features of SAP Analytics Cloud is utilized to enhance the experience for the solution users.
Why SAP HXM 360 with BTP Apps?
HXM stands for Human Experience Management and focuses on putting people at the center of business to drive transformative results. Like HCM, HXM connects core HR and payroll, talent management, and people analytics, but with a unique focus on the employee experience. By understanding, anticipating, and listening to the needs and expectations of everyone, HXM enables organizations to deliver relevant experiences for employees, managers, candidates, new hires, HR leaders, administrators, and more.
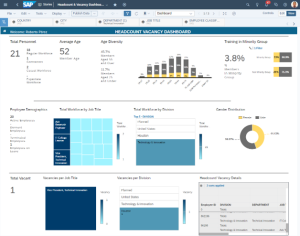
Headcount and vacancy dashboard
The Headcount And Vacancy Dashboard Allows The Business Roles To Plan And Budget Strategically Using The Below Information.
- Total Number of employees and total vacancy position.
- Age and Gender Diversity across the Organization.
- Employee’s Demographic data.
- These data can be viewed based upon Department, Division, Job Title and Location

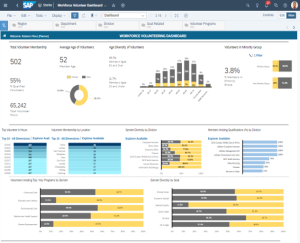
Workforce volunteer dashboard
Data that we can look forward to in this dashboard involves,
- Top volunteers in the organization.
- Volunteers availability based on demographics.
- Volunteer data based on organization goals.
- Visual representation of different volunteering categories.

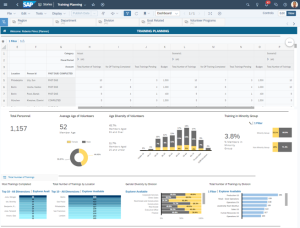
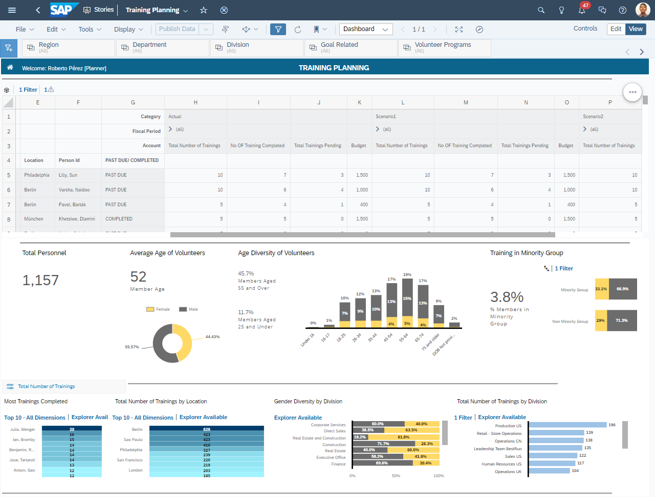
Training planning dashboard
- Based on position or department, the organization can plan the number of training an employee should complete.
- This dashboard can also track training completed against assigned training.
- Allows us to calculate the actual budget against the planned budget
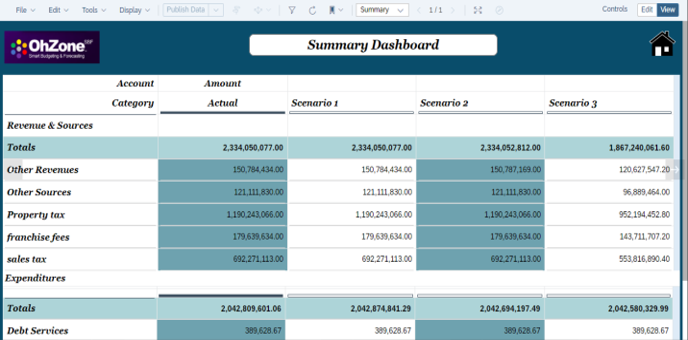
Employee Expense
- A consolidated view of all the Revenue plans and Expense Plans published under a department/ Cost Center. Role-based queries and data privacy can be enabled to restrict the planning scope the user is able to see.
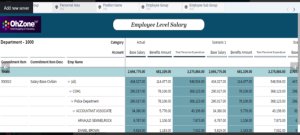
Employee Salary
- Allows personnel expense planning on specific positions within a department. Department Drill-down capabilities enable the planner to view and edit individual salaries by the employee and view the changes roll-up to the Department Level.

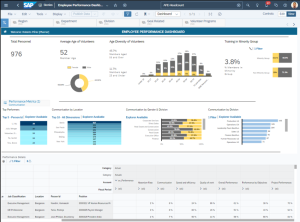
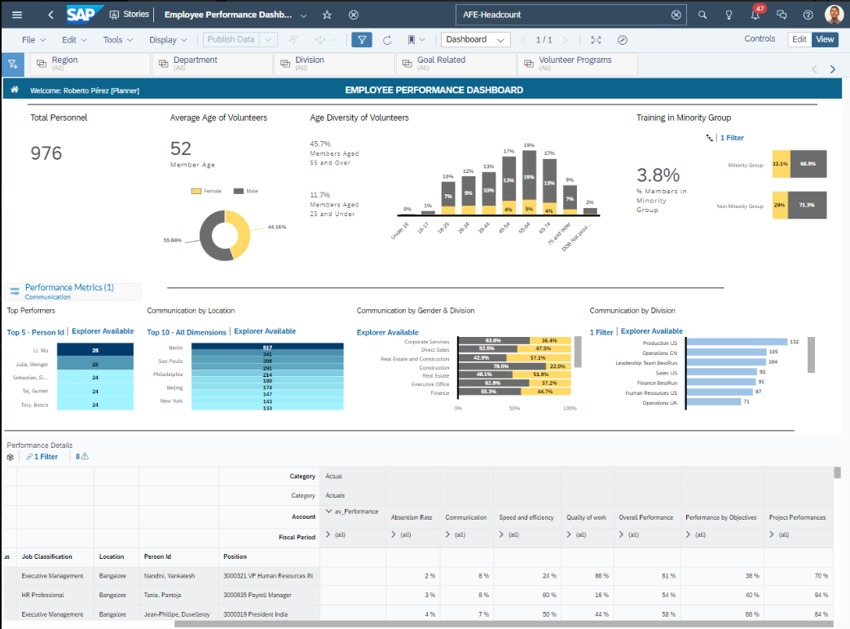
EMPLOYEE PERFORMANCE DASHBOARD
360-DEGREE FEEDBACK METRICS USED TO DETERMINE EMPLOYEE PRODUCTIVITY
- Quality Of Work.
- Absenteeism Rate.
- Completion Of Training On Time.
- Performance By Objectives.
- Performance On Goals.
- Performance Based Upon Projects.
Headcount and vacancy dashboard
The Headcount And Vacancy Dashboard Allows The Business Roles To Plan And Budget Strategically Using The Below Information.
- Total Number of employees and total vacancy position.
- Age and Gender Diversity across the Organization.
- Employee’s Demographic data.
- These data can be viewed based upon Department, Division, Job Title and Location
Workforce volunteer dashboard
Data that we can look forward to in this dashboard involves,
- Top volunteers in the organization.
- Volunteers availability based on demographics.
- Volunteer data based on organization goals.
- Visual representation of different volunteering categories.
Training planning dashboard
- Based on position or department, the organization can plan the number of training an employee should complete.
- This dashboard can also track training completed against assigned training.
- Allows us to calculate the actual budget against the planned budget
Employee Expense
- A consolidated view of all the Revenue plans and Expense Plans published under a department/ Cost Center. Role-based queries and data privacy can be enabled to restrict the planning scope the user is able to see.
Employee Salary
- Allows personnel expense planning on specific positions within a department. Department Drill-down capabilities enable the planner to view and edit individual salaries by the employee and view the changes roll-up to the Department Level.
EMPLOYEE PERFORMANCE DASHBOARD
360-DEGREE FEEDBACK METRICS USED TO DETERMINE EMPLOYEE PRODUCTIVITY
- Quality Of Work.
- Absenteeism Rate.
- Completion Of Training On Time.
- Performance By Objectives.
- Performance On Goals.
- Performance Based Upon Projects.
Benefits
Comprehensive HR Analytics
Covers all critical HXM modules — Recruitment, Engagement, Training, Compensation, Productivity, and Retention — offering a 360° view of the workforce.
Data-Driven Decision Making
Provides real-time, actionable insights that help HR leaders and executives make smarter, faster business decisions.
Pre-Built Dashboards
Ready-to-use templates reduce implementation time and enable quicker adoption without starting analytics from scratch.
Enhanced Recruitment and Staffing
Optimizes workforce planning, recruitment strategies, and vacancy management through insightful analytics.
Improved Workforce Engagement
Tracks employee satisfaction, absenteeism, and exit feedback, helping organizations improve engagement and retention.
Strategic Talent Development
Monitors training effectiveness, skill growth, and learning outcomes to align employee development with organizational goals.
Smarter Compensation Planning
Provides a detailed breakdown of salary and benefits, helping HR ensure competitive and fair compensation practices.
Boosted Productivity & Performance Tracking
Identifies top performers and areas for improvement, driving alignment between individual output and organizational objectives.
Increased Employee Retention
Tracks attrition rates and resignation reasons, offering insights that help build effective retention strategies.
SAP Analytics Cloud Planning Integration
Advanced forecasting, simulation, and budgeting capabilities enhance strategic workforce planning.
Why Sierra Digital?
Proven Track Record
We have successfully implemented SAP HXM 360 and BTP solutions for organizations across various industries, enhancing workforce efficiency and employee satisfaction.
Certified SAP Expertise
Our team consists of SAP-certified consultants with deep expertise in HXM, SuccessFactors, and BTP applications.
Tailored Digital HR Solutions
We design and implement custom solutions that align with each organization’s unique workforce strategy and HR objectives.
Commitment to Excellence
Sierra Digital is dedicated to delivering high-quality, innovative HR technology solutions that drive measurable business value.
Revolutionize Your HR Strategy with SAP HXM 360 & BTP
Contact us today to explore how we can help transform your
HR experience with SAP HXM 360 and BTP applications.
ASK OUR EXPERT